"Investing made easy" find solutions for all your financial queries with "expert advice" on personal finance, stock market investments, mutual funds investments, real estate all at one place.
The Intelligent Investor is a book of American author Benjamin Graham and published in 1949. Benjamin Graham was a British-born American economist, professor and investor. He is widely known as the “father of value investing”, and wrote two of the founding texts in neoclassical investing: Security Analysis, and The Intelligent Investor.
The Intelligent Investor by Benjamin Graham is one of the best investing books that is still being used by most successful investors, which includes Warren Buffett and other popular investors. Furthermore, this classic investing book has placed a huge influence on the millions of both newbies and advanced investors worldwide.
The key concept behind this book is mainly concentrated on the” value investing” principle in which the investors should have both analytical skills and mental fortitude to select the stock at a bargain price.
In other words, billionaire Warren Buffett, the Oracle of Omaha argues in the book that you do not need to have a super high IQ to become successful as a stock market investor. It’s because as long as you have a strong mental fortitude to stay in the game throughout the market turbulence and be able to make a rational decision in the stock market investment.
Key Highlights of book
In this review, we will discuss the given 4 main areas from ” The Intelligent Investors by Benjamin Graham”, which will give you an overview picture of key principles behind this book. Hopefully, you should learn and get familiar with those key principles, and be able to apply them to your investing journey.
1. Are you an Investor or Speculator?
2. The concept of Value Investing and Intrinsic Value
3. The Warren Buffett Way
4.The Margin of Safety
1. Are you an Investor or Speculator?
Before moving to the main review of ” The Intelligent Investor by Benjamin Graham”, you should ask yourself the question ” Are you an investor or speculator?. It’s one of the critical viewpoints to challenge yourself, which allows you to determine the type of investor you are.
The author (Benjamin Graham the intelligent investor) explains clearly the two key concepts in this book that help both newbies and advanced investors to stay away from the trap of not making a rational decision over investment. I do agree with the suggestion in this book that we should make a clear distinction between investment and speculation.
Investor: is the one who has critical skill and knowledge in the field of investment. Importantly, they always use those skills and expertise to do proper research before making a rational decision based on their knowledge and skill without any bias.
Speculator: normally describe people who do not have the proper knowledge and expertise in stock market investing. They quickly jump to the conclusion by just guessing, and often they make a huge mistake in terms of lack of preparation and knowledge.
2. The Concept of Value Investing and Intrinsic Value
As mentioned before, the main concept of this book is all about value investing philosophy, where Benjamin Graham laid out the very first foundation concept in the book. In particular, a long-term investment strategy is always the best option to keep a hold of the stocks for a long period of time, and then you sell when the price is up for profit. Despite this, others are busy with their trading and taking big risks on their investment.
This is one of the most fascinating ideas to learn and adopt in making a smarter decision over stock selection. For this reason, I strongly agree with the point that constant trading makes you pay more for commissions and taxes.
While the idea of value investing is to remind everyone to stay patient and wait until they find the equity is undervalued, and then they can invest in it and stay in it in the long game. Graham argues that market volatility is just a part of investing, and investors should not panic to make a silly mistake during a market downturn.
In order to determine a good investment decision, investors need to take a comprehensive analysis of the equity such as company performance, financial performance in both revenue and net income, calculate the intrinsic value, check on future earning and management style. Throughout the history of the stock market, we all have witnessed the rise and fall of the stock market, but main important thing is to stay focus and stick with the plan you have in mind.
The intelligent investor by Benjamin Graham is one of the best investing books, where you will learn all about the key principles associated with value investing, the margin of safety, and long-term investment strategy. Those could be set as a foundation to reach your end goals.
3. The Warren Buffett Way
Benjamin Graham is a founding father of the “ Value Investing” principle, and he was a mentor and a professor of Warren Buffett, the most successful investor on the planet. Throughout the time Warren Buffett learned from his mentor and read the book, these things directly shaped his investing principle and ideology, which earned him one of the richest people on earth and the title” a legendary investor” and ” Oracle of Omaha“.
CHARLIE MUNGER & WARREN BUFFET
Warren Buffett started to read the first edition of the book ” The Intelligent Investor” when he was 19 years old. Over time, the principles in this book have placed a huge impact on his investing style, which he and his longtime partner Charlie Munger have built a successful conglomerate empire, The Berkshire Hathaway Inc.
Until recently, Sir Warren Buffett still thinks ” The Intelligent Investor, is the best investing book of all time. It’s because it shapes his investing principle and philosophy. Throughout Berkshire Hathaway’s annual meeting over the years, Warren Buffett always mentions the concepts and important chapters in this book to the shareholders, and always uses principles in the book to answer or give advice to others.
Value investing strategy is still applicable in modern investing as you can see Warren Buffett has successfully implemented this type of investing principle throughout his investing career. He has made billions of dollars by adopting this strategy- buys low and sells high based on acquiring shares from the quality business. Therefore, if you are currently searching for stock market investing books to read, the “ Intelligent Investor” is a must-read one because the book highlights all the fundamental principles associated with the value investing strategy.
4. The Margin of Safety
The margin of safety is another most critical principle that helps you to increase the chance to select the right stock investment for creating long-term success. In particular, the author challenges all types of investors to conduct proper research about a particular stock including assets quality, performance, future earning, management style, P/E, and industry performance, which allow you to identify the “Intrinsic value” of the stock.
By conducting the margin of safety of security, it might help to increase the chance to determine the stock whether is overvalued or undervalued. For this reason, the investor can take the analysis based on the margin of safety, and make their own decision for selecting the appropriate security.
The margin of safety is the main reason to distinguish between investor and speculator. It’s because the true investor will try to execute knowledge in the investing by calculating every key aspect of the margin of safety, which might help them to increase the chance of success in the market.
Final words:
Money we all know it’s important. But it’s not necessarily something we all know a lot about. For example, we might know that it’s important to manage our finances wisely, to budget, to save, to stay out of debt, but we might not be able to identify concrete action steps that will help us do that. It can be even tougher when you feel like the financial deck is stacked against you, and unfortunately, that’s the future that many people face. But those struggles don’t have to write a future of financial despair.
The Intelligent Investor is a book that aims to help people invest in the stock market while minimizing their economic risks. It focuses on longer-term and more risk-averse approaches. Graham focuses on investments (based on research) rather than speculations (based on predictions). The Intelligent Investor provides guidance on how to get involved in value investing and how you can prevent Mr. Market from dictating your financial decisions.
“The intelligent investor” by Benjamin Graham is a must-read for all types of investors. By applying all critical principles from the book, the investor would be able to highlight the true intrinsic value of the stock and can make their own decision based on their analysis.
Buy book “The intelligent investor” by Benjamin Graham
Swing Trading is a strategy that focuses on taking smaller gains in short term trends and cutting losses quicker. The gains might be smaller, but done consistently over time they can compound into excellent annual returns. Swing Trading positions are usually held a few days to a couple of weeks, but can be held longer.
How Swing Trading works for traders
Swing trading seeks to capitalize on the upward and downward “swings” in the price of a security. Traders hope to capture small moves within a larger overall trend. Swing traders aim to make a lot of small wins that add up to significant returns. For example, other traders may wait five months to earn a 25% profit, while swing traders may earn 5% gains weekly and exceed the other trader’s gains in the long run.
Most swing traders use daily charts (like 60 minutes, 24 hours, 48 hours, etc.) to choose the best entry or exit point. However, some may use shorter time frame charts, such as 4-hour or hourly charts.
Let's start with the basics of a swing trading strategy. Rather than targeting 20% to 25% profits for most of your stocks, the profit goal is a more modest 10%, or even just 5% in tougher markets. Those types of gains might not seem to be the life-changing rewards typically sought in the stock market, but this is where the time factor comes in.
The swing trader's focus isn't on gains developing over weeks or months; the average length of a trade is more like 5 to 10 days. In this way, you can make a lot of small wins, which will add up to big overall returns. If you are happy with a 20% gain over a month or more, 5% to 10% gains every week or two can add up to significant profits.
Of course, you still have to factor in losses. Smaller gains can only produce growth in your portfolio if losses are kept small. Rather than the normal 7% to 8% stop loss, take losses quicker at a maximum of 3% to 4%. This will keep you at a 3-to-1 profit-to-loss ratio, a sound portfolio management rule for success. It's a critical component of the whole system since an outsized loss can quickly wipe away a lot of progress made with smaller gains.
Swing Trades vs. Day Trading
Swing trading and day trading appear similar in some respects. The main factor differentiating the two techniques is the holding position time. While swing traders may hold stocks overnight to several weeks, day trades close within minutes or before the close of the market.
Day traders do not hold their positions overnight. It often means they avoid subjecting their positions to risks resulting from news announcements. Their more frequent trading results in higher transaction costs, which can substantially decrease their profits. They often trade with leverage in order to maximize profits from small price changes.
Swing traders are subjected to the unpredictability of overnight risks that may result in significant price movements. Swing traders can check their positions periodically and take action when critical points are reached. Unlike day trading, swing trading does not require constant monitoring since the trades last for several days or weeks.
Most Used Swing Trading Indicators
1. Moving Averages
Moving averages are simply the average of the stock prices over a given period and smoothen out any erratic short-term spikes.
They are referred to as the lagging indicators as they don’t look back over past price action. Thus, Moving Averages are mainly used for confirming trends and used in swing trading.
Moving Averages can be categorized into short-, medium- or long-term, based on the number of the periods such as 50- or 200-days moving average.
Moving Averages are mainly of two types :
Simple moving averages, which take all the closing prices of a specific period and averages them out, and Exponential moving averages that give more weightage to the price which is closer to the current date.
Having discussed the basics of moving average, let’s see the use of this indicator in swing trading :
Swing traders use moving averages when a market’s short-term Moving Average crosses a longer-term Moving Average indicating that a change in momentum is taking place. When a faster Moving Average crosses a slower Moving Average from below then it indicates a bull move. When a faster Moving Average crosses a slower one from above, then the momentum may be reversing to a bearish move.
2. Volume
Volume is an important indicator in swing trading as it tells us about the strength of the ongoing trend. Usually, a trend with high volume is stronger than one with weak volume. As more traders buy or sell, it forms a better basis for the price action.
Volume is crucial when there is a breakout in the trend. Generally, breakouts follow a period of consolidation accompanied by low volume. So, when the breakout occurs then volume spikes.
There are different types of volume indicators that signal whether the volume is rising or falling in the stock.
3. Relative Strength Index
Momentum Indicators are popular among the swing traders and especially Relative Strength Index, which shows whether the stock’s prices are in overbought or the oversold zone.
Usually, when the prices are above the 70 levels, then we considered it in the overbought zone, on the other hand when the prices are below the 30 levels, it is considered to be an oversold zone.
When the prices are in the overbought zone, it usually indicates the prices may reverse to the downtrend, and when the prices are in the oversold zone, it usually indicates the prices may reverse to an uptrend.
Thus, this indicator can be used in swing trading, as it tells us when the trend is going to reverse.
4. Stochastic Oscillator
The stochastic oscillator is another type of momentum indicator that works almost similar to the RSI. This indicator compares the closing price of a stock to the range of its prices over a particular period.
Like the RSI, the stochastic oscillator also shows the overbought and oversold zone. In this case, 80 is usually considered as overbought while under 20 is oversold. However, it comprises 2 lines, unlike RSI. One shows the current value of the oscillator whereas the other shows three-day MA.
Advantages of Swing Trading :
Less Time:
Generally, intraday traders have to monitor their positions every minute. However, as Swing Trading has a predetermined horizon, it takes less time to execute and in monitoring the positions.
Short-term profits:
Swing Trading allows investors to make quick and short-term profits by capturing the bulk of the current trend and market swings. If the trend is upwards, Swing Trading can allow investors to make hefty profits in a short period.
Indicators:
Swing Trading includes the use of technical analysis and fundamental analysis. As the included indicators are reliable and used by almost all the investors, Swing Trading becomes less risky when compared to other short-term financial instruments.
Flexibility:
One of the most important advantages of Swing Trading is that it doesn’t legally bind an investor to sell the shares after a specific time. If you are at a loss after your set time horizon, you have the complete freedom and flexibility to hold the shares for a longer time. Under Swing Trading, you do not have to sell your positions at a loss.
Financial goals:
Swing Trading can allow investors to achieve their short-term financial goals without having to cover the expenses with their savings. Swing Trading provides these investors with a way to invest their savings for a short period and remove their invested amount along with the profits.
Finally, Swing traders use various strategies more experienced traders will use advanced and complex techniques. However, these simple strategies will help you lay a strong foundation. Whether swing trading is your style or not, you can’t deny the importance of learning the various trading techniques to become more surefooted in the stock market. When it comes to stock trading, nothing can beat the power of knowledge.
Open demat account with India's No-1 broker ZERODHA....
Wishing you all 12 months of success, 52 weeks of laughter, 365 days of fun, 8760 hours of joy, 525600 minutes of good luck, and 31536000 seconds of happiness.
Happy New Year 2022
Introduction
Chart analysis has become more popular than ever. One of the reasons for that is the availability of highly sophisticated, yet in-expensive, charting software. The average trader today has greater computer power than major institutions had just a couple of decades ago. Another reason for the popularity of charting is the Internet. Easy access to Internet charting has produced a great democratization of technical information. Anyone can log onto the Internet today and see a dazzling array of visual market information. Much of that information is free or available at very low cost.
Another revolutionary development for traders is the availability of live market data. With the increased speed of market trends in recent years, and the popularity of short-term trading methods, easy access to live market data has become an indispensable weapon in the hands of technically oriented traders. Day-traders live and die with that minute-to-minute price data. And, it goes without saying, that the ability to spot and profit from those short-term market swings is one of the strong points of chart analysis.
Charts can be used by themselves or in conjunction with fundamental analysis. Charts can be used to time entry and exit points by themselves or in the implementation of fundamental strategies. Charts can also be used as an alerting device to warn the trader that something may be changing in a market’s underlying fundamentals. Whichever way you choose to employ them, charts can be an extremely valuable tool—if you know how to use them.
History of Candlesticks
If you are trading or thinking of getting into trading, Technical Analysis or TA is a very important part of the process. With out looking into Technical Analysis and understanding TA, it would be very difficult to be profitable in your trading sessions.
Technical Analysis is made up of a whole load of tools, including analyzing charts of the movement of price of a given stock over a period of time. Using these charts to predict the future price of that stock is what technical analysis is all about.
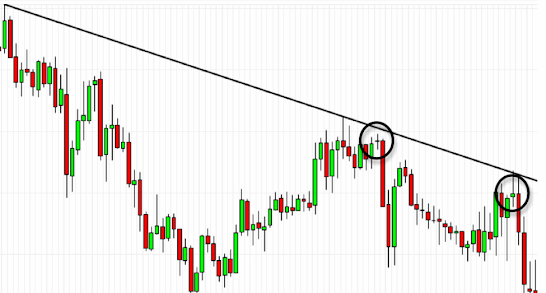
There are various methods of representing the price and time data on these charts such as lines, bars etc. But a new method, called the “Candlesticks Charting”, based on a Japanese system, was brought to the west in the 1900 by Charles Dow.
Over 150 years ago, a Japanese rice trader names Homma Munehisa is credited to have come up with a system of charting that used candlesticks giving an overview of open, high, low, and close market prices of rice over a certain period. Until about 1710, only physical rice was traded but then a futures market emerged where coupons, promising delivery of rice at a future time, began to be issued. From this, a secondary market of coupon trading emerged in which Munehisa flourished. Stories claim that he established a personal network of men about every 6 km between Sakata and Osaka (a distance of some 600 km) to communicate market prices.
The system that Homma created to help him analyze the price movements of rice back in the 18th century became popular in the 1990s, largely thanks to Steve Nison, who tracked down and translated a huge collection of Japanese texts that described the Candlestick charting method. Today, almost every one knows about the candlestick charting method and almost all trading and analysis software display candlesticks and even name and explain the candlestick patterns and formations.
Candlestick Shapes
Basic candlestick anatomy
Whenever you look at a price chart, you will select a timeframe for that chart – perhaps it’s a minute or an hour or a day. Rather than simply plotting the open or close price for that time frame, the candlestick gives you information about what went on during that period of time. Having all this extra information, gives you a heads-up about market sentiment and can offer invaluable clues about the way the market will move.
Having all this extra information, gives you a heads-up about market sentiment and can offer invaluable clues about the way the market will move.
What Candlesticks Don't Tell You
Candlesticks do not reflect the sequence of events between the open and close, only the relationship between the open and the close. The high and the low are obvious and indisputable, but candlesticks (and bar charts) cannot tell us which came first.
Types of Candlesticks
The Doji
The Dojiis a candlestick where the opening and closing prices are the same (or almost the same). It can take many forms, as shown here, depending on what the trading activity was in that period.
What’s key with a doji is that neither the bears nor the bulls have gained control, and that the price has ended where it began. It’s a sign of indecision in the market, and could (in conjunction with other indicators) signal a change in market direction.
Applying doji candlesticks: a good trick is to look out for a doji near the edge of a price channel (i.e., if a doji appears at the top of a channel it could indicate a bearish correction.)
The Marubozu
The text-book marubozu is a long candle, which implies that the day’s trading range has been large. And it should have no upper or lower wick (“marubozu” in Japanese means “shaved”).
A green (or white) marubozu signals strong conviction among buyers, while a red (or black) marubozu indicates that sellers hare eager to flee.
In practice, when you’re looking at charts, a marubozu will often have a short wick at the top or the bottom.
The Harami (Bullish & Bearish)
The harami is one of the most common candlestick patterns you’ll come across, so it’s important to recognize it – to understand what it means, and to understand its limitations.
A harami is a two-session reversal pattern – i.e. it’s made up of two candlesticks and implies that the price is about to turn. It is indicated by a small body of the opposite colour, completely contained by the body of the previous session. It is not essential for the two candles to be opposite colours, but this tends to give a more reliable signal.
As you can see here, the body of the small black candle is completely within the confines of the body of the previous white candle. This indicates that the upward trend is running out of steam.
Here are a couple of examples:
This bullish harami shows the sellers beginning to dominate as they come back into the market:
This bearish harami has a shadow that extends beyond the body of the previous candle – some traders wouldn’t regard this as a “true” harami. However, it’s body is entirely within the previous green candle, and a reversal follows.
A harami doesn’t always live up to its hype. While it is touted as a “reversal indicator” – you may find yourself disappointed by its reliability. The psychology behind a harami is that a possible change in sentiment may be happening. The small candle does not necessarily mean a strong reversal is coming. Often with a harami pattern, several days of tight range trading, referred to as “congestion” or “consolidation,” will follow.
A harami on its own says “the chart MIGHT reverse.” It is best to look for confirmation and to combine the harami with other longer-term patterns.
The Hammer (bullish) & The Hanging Man (bearish)
This is one of the best-known reversal indicators …
It is a candlestick pattern that consists of just one candle (although with candlesticks it is always best to view them in context of the candlesticks around them – in particular the candle that follows immediately after).
The hammer or hanging man candle has a long lower wick, short body, and little or no upper wick. Strictly speaking, the lower wick should be at least two times longer than the body – the longer, the better. And depending on where you find it on a chart, it is called either a hammer or a hanging man.
A hammer: is found in a downtrend, and signals a bullish reversal. The long lower wick shows a period in which sellers where in control, but the body shows buyers coming back in. From this we can tell that there is strong buying by bulls as the period of sell-off declines.
As with all single candlestick patterns, we should wait for next candle to confirm that buyers are in control.
Note how the strong selling action and increased volume (indicated by the long lower wick) on the candlestick is reversed as buyers come back in, and that this coincides with an oversold indicator on Stochastics. The green candlestick opening above the body of the hammer confirms the bullish trend.
A hanging man: is the same shape as hammer, but found in an uptrend. We don’t expect to see strong selling pressure (seen in the long lower wick on the candle) in an uptrend, so here it suggests a change of market sentiment and a reversal to downside.
In this case, the hanging man shape coincides with the Stochastics showing the price to be overbought, and the next candle confirms the move.
There's no hard and fast rule about what colour a hammer or a hanging man should be – the fact that they have a short body already means that there's indecision coming into the market. However, a green (or white) hammer and a red (or black hanging man) are stronger indicators.
Inverted Hammer (bullish) & Shooting Star (bearish)
This candlestick is, as you would expect – a hammer turned on its head …
It is a candle with a small body and long upward wick, signally a possible reversal. Where it appears in a chart affects whether it’s an inverted hammer or a shooting star.
An inverted hammer forms after a downtrend or at the bottom of a period of consolidation. The reversal isn’t confirmed until you have a bullish candle in the next period.
A shooting star forms after an uptrend or at the top of a period of consolidation.
Inverted hammers and shooting stars can have green or red bodies – what’s important here is that the body size is small, that the upper wick is at least twice the length of the body, and the lower wick is negligible.
Engulfing (Bullish & Bearish)
An engulfing pattern signals a reversal, and can be bullish or bearish. It comprises two candles. The body of the second must engulf the body of the first, and must be the opposite colour to the first.
For a bullish engulfing candle, we have a smaller red candlestick, followed by a green candlestick, the body of which is greater in size that the previous candle.
For a bearish engulfing candle, the first candlestick is smaller and green, followed by a red candlestick, the body of which engulfs the previous candle.
In this example of a bearish engulfing pattern, we have a clear uptrend, where the final candle has a red body, which engulfs the body of the previous candle. This suggests that strong selling pressure has come into the market, and could indicate a reversal or period of stagnation.
Conclusion
Candlestick charts provide more information than other types of charts because they combine the open, high, low and close prices into one graph. The variety of different chart patterns that can be analyzed on candlestick charts is extensive and beneficial to learn.
Candlestick patterns are very useful - and they get stronger when combined with various other technical studies. For example, combining candlestick patterns with support/resistance, oscillators or Fibonacci can lead to really good setups.
Importantly, you need to learn how to read candlestick patterns properly to improve your trading skills and find your edge in the markets.
Open demat account with India's No-1 broker ZERODHA....